A free calculator for North Carolina city, town, and county finance officers. Enter numbers from an audit and the tool shows which of the 17 state Local Government Commission Financial Performance Indicators would be flagged, and by how much. Everything runs in the visitor's browser, with no data saved or sent anywhere, and all thresholds live in a single data file so the tool is easy to update when the state changes them.
View calculatorSelected Work
Projects & Research
A selection of my consulting projects, policy research, and data work.
All Projects
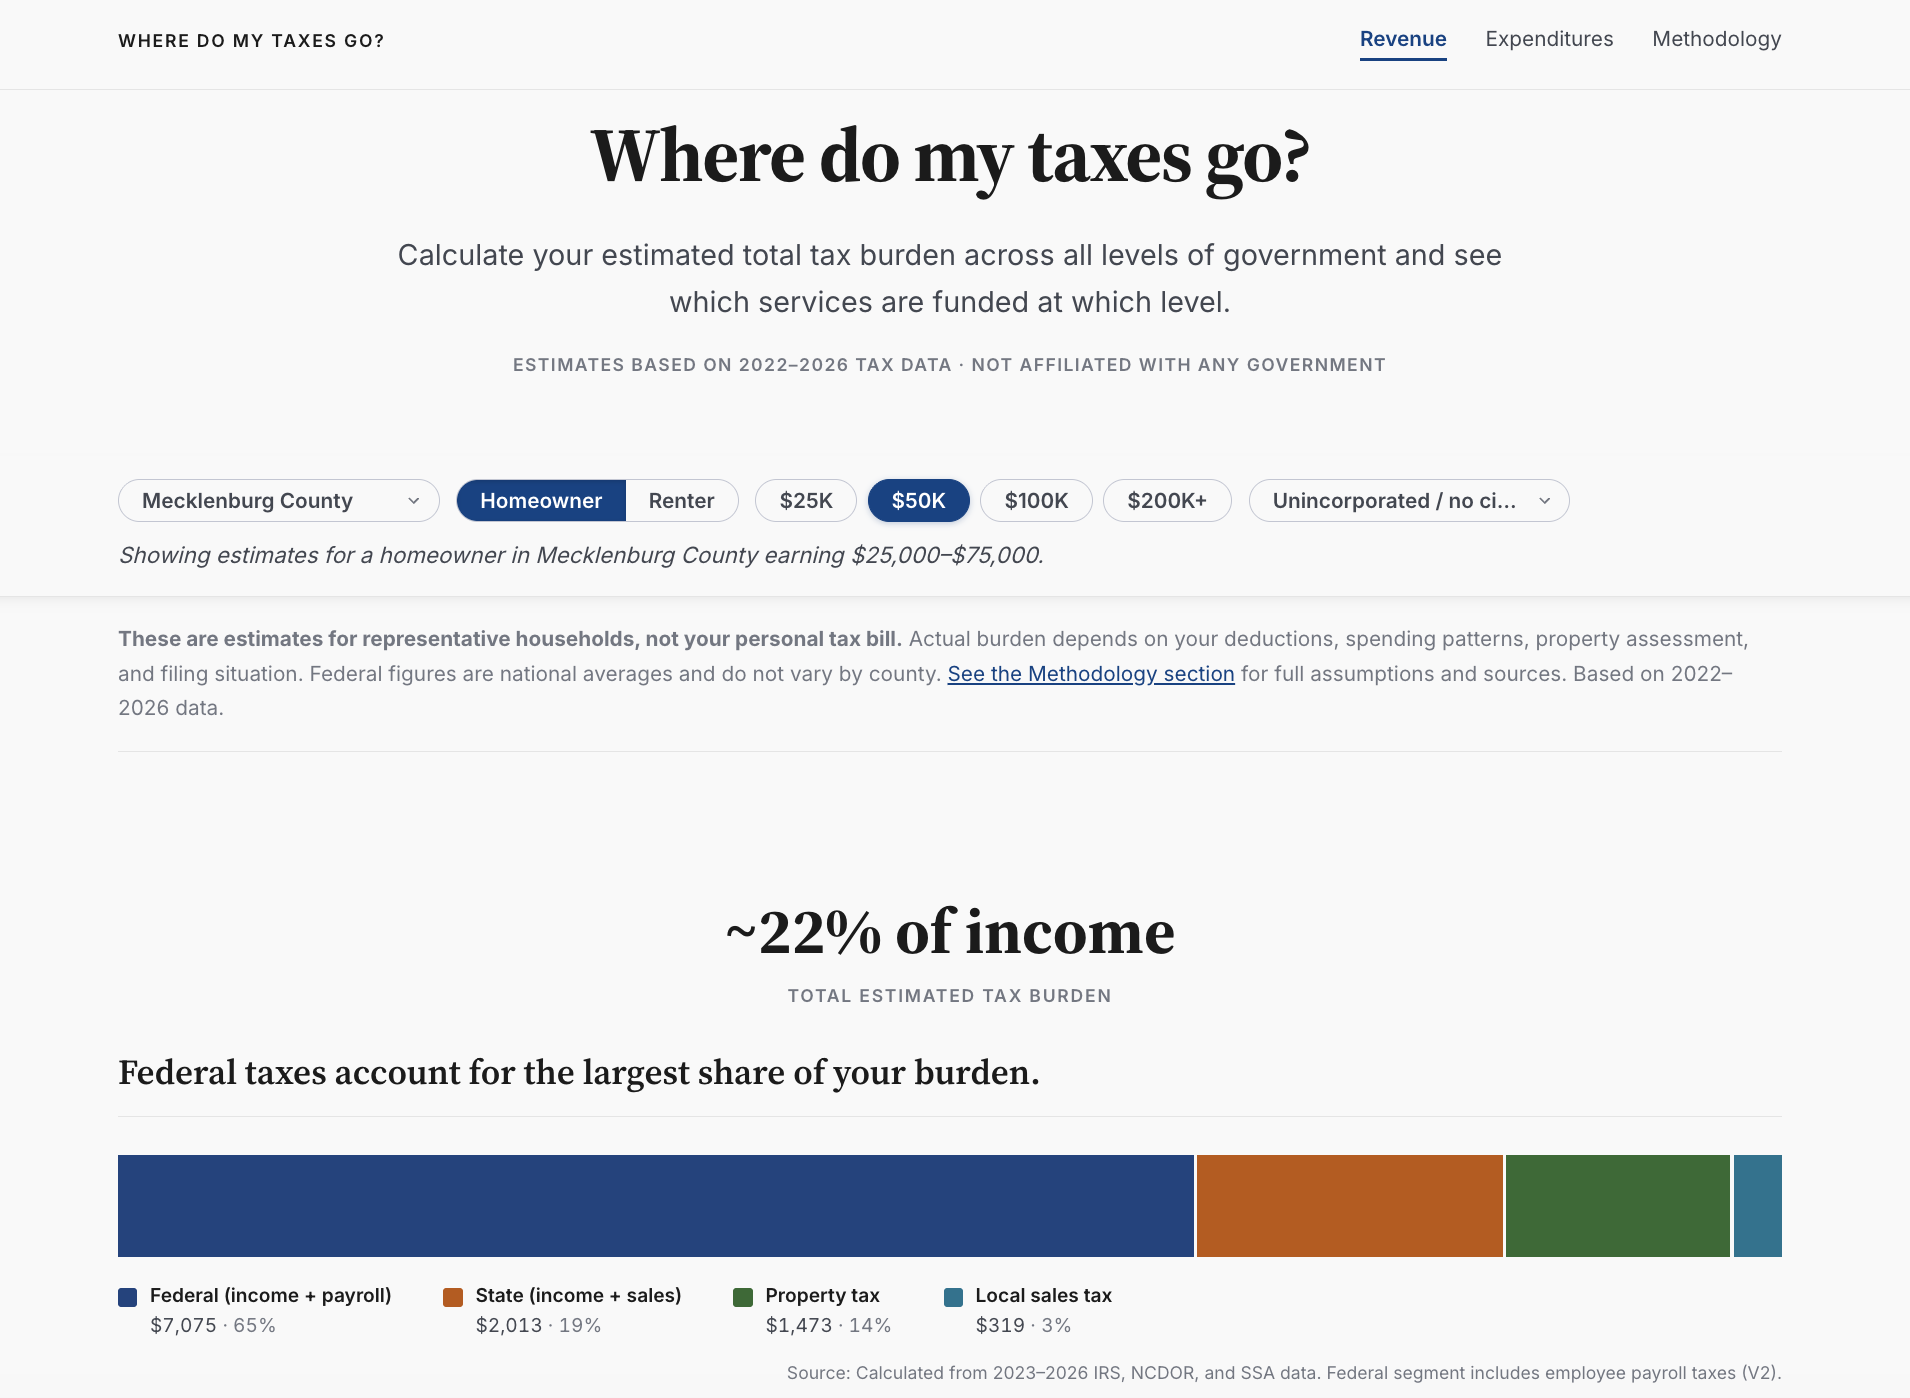
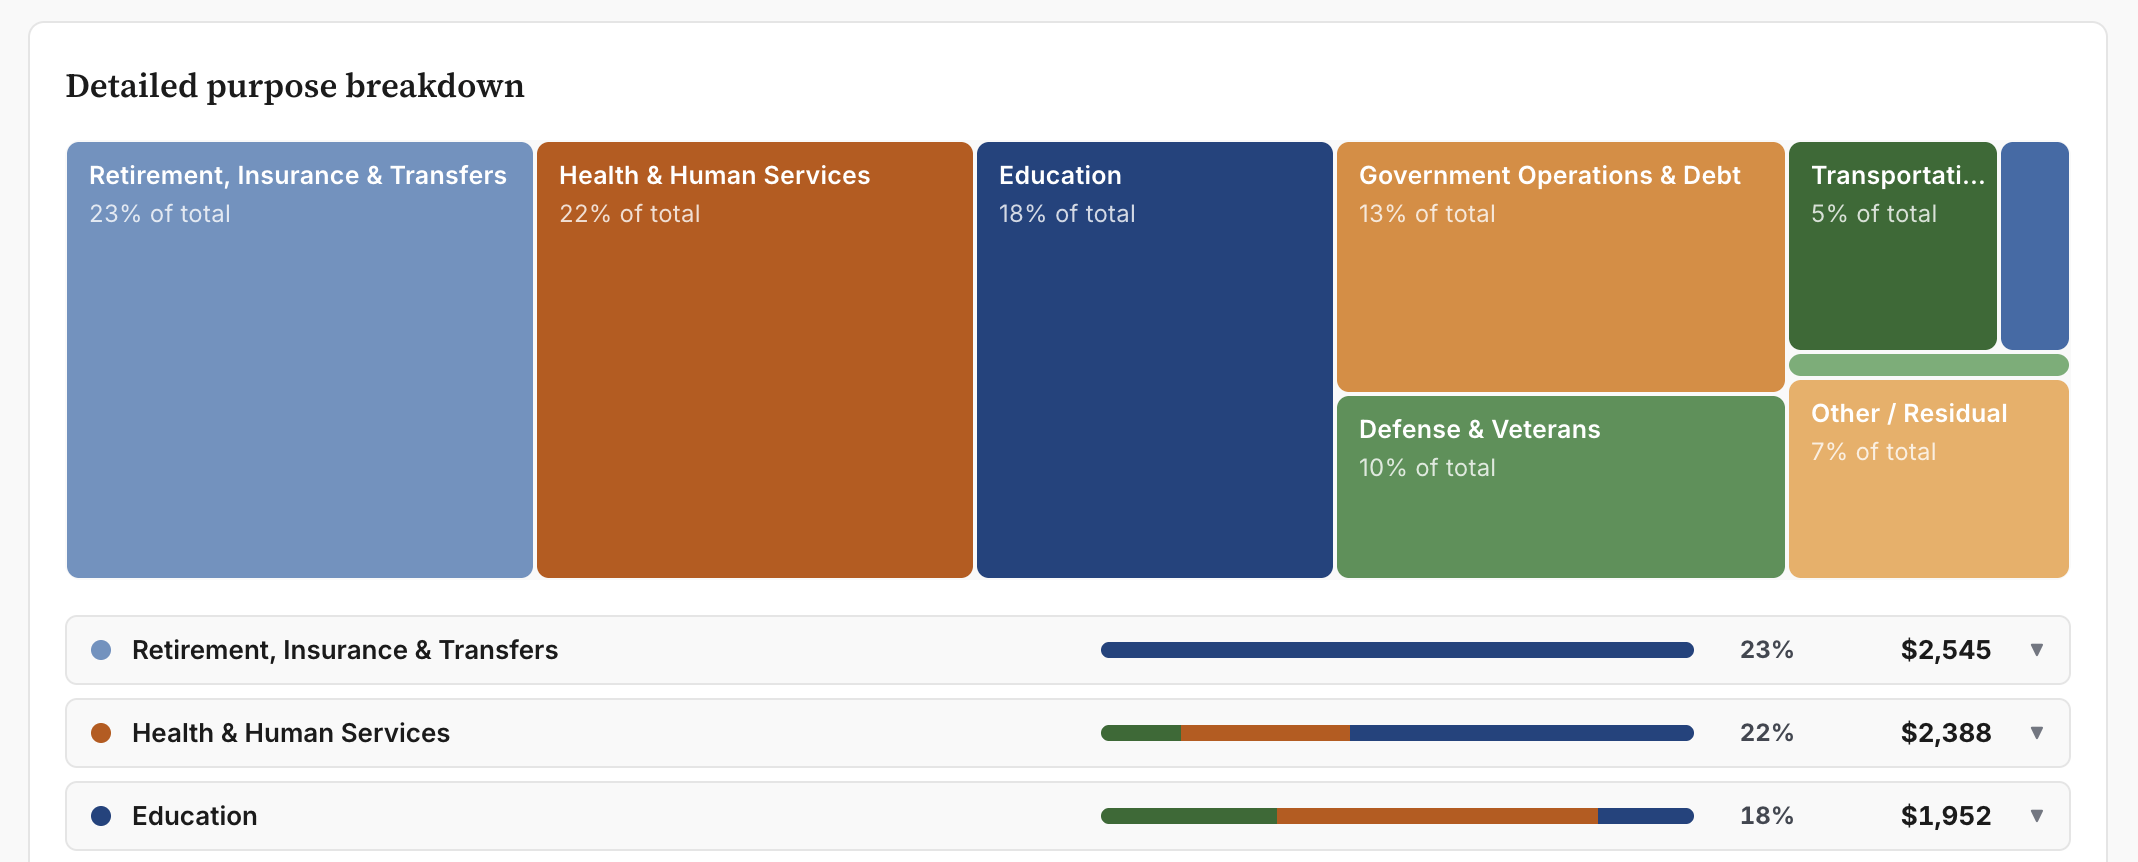
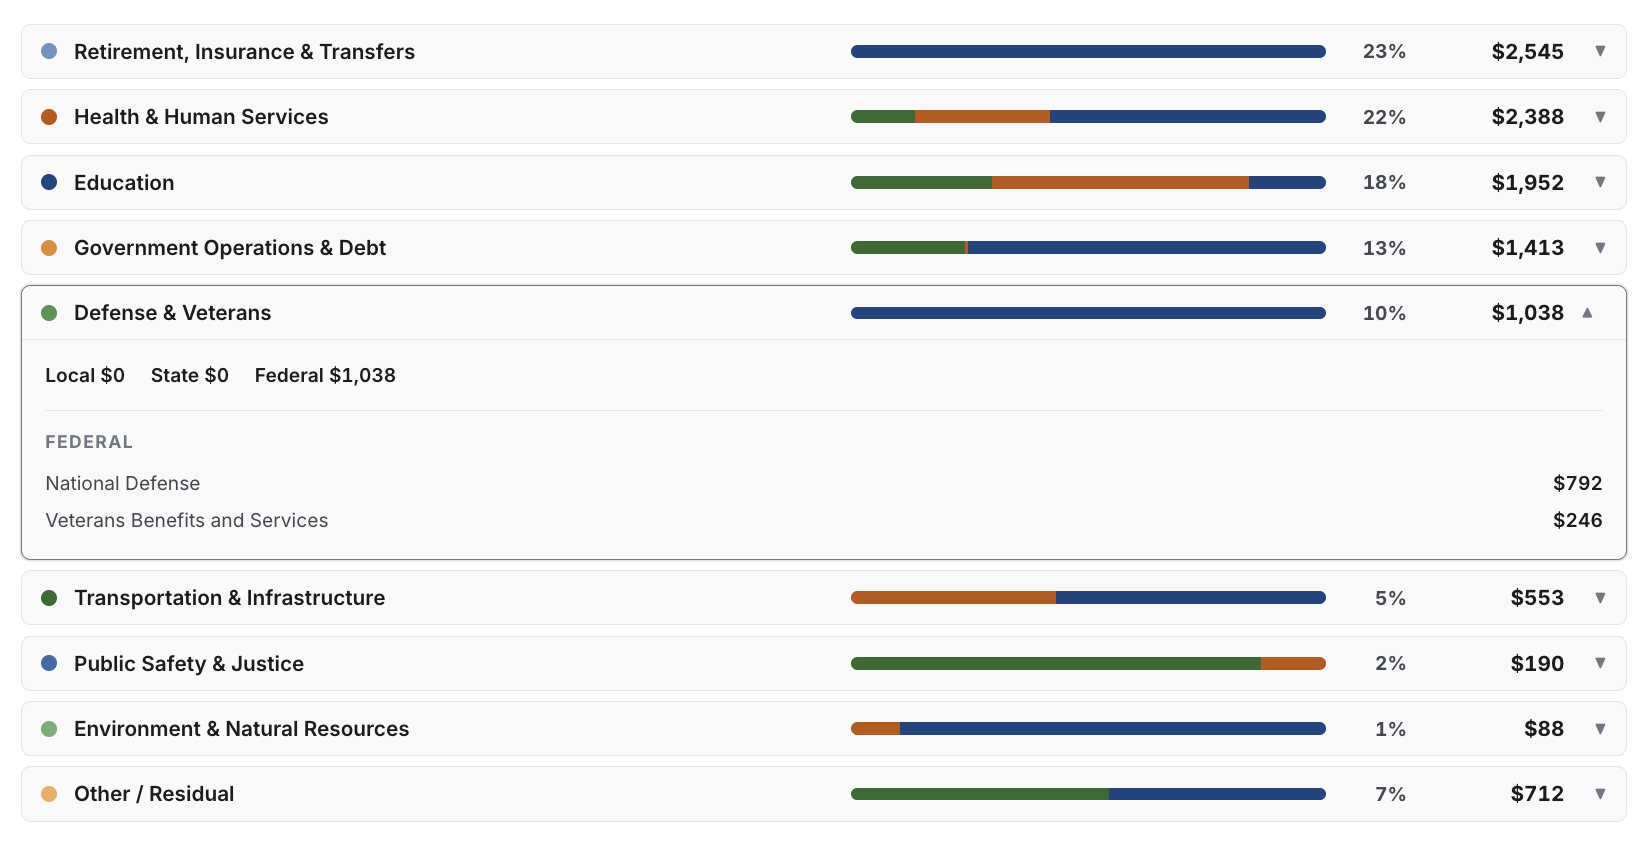
Ever wondered exactly how much you spend on K-12 education each year? This tool helps North Carolina residents see how their state, county, and local taxes are collected and where that money is actually spent. Users can estimate their annual tax burden by county, income bracket, and housing status across property, sales, state income, federal income, and payroll taxes, then trace that estimate directly into spending categories like education, public safety, and infrastructure.
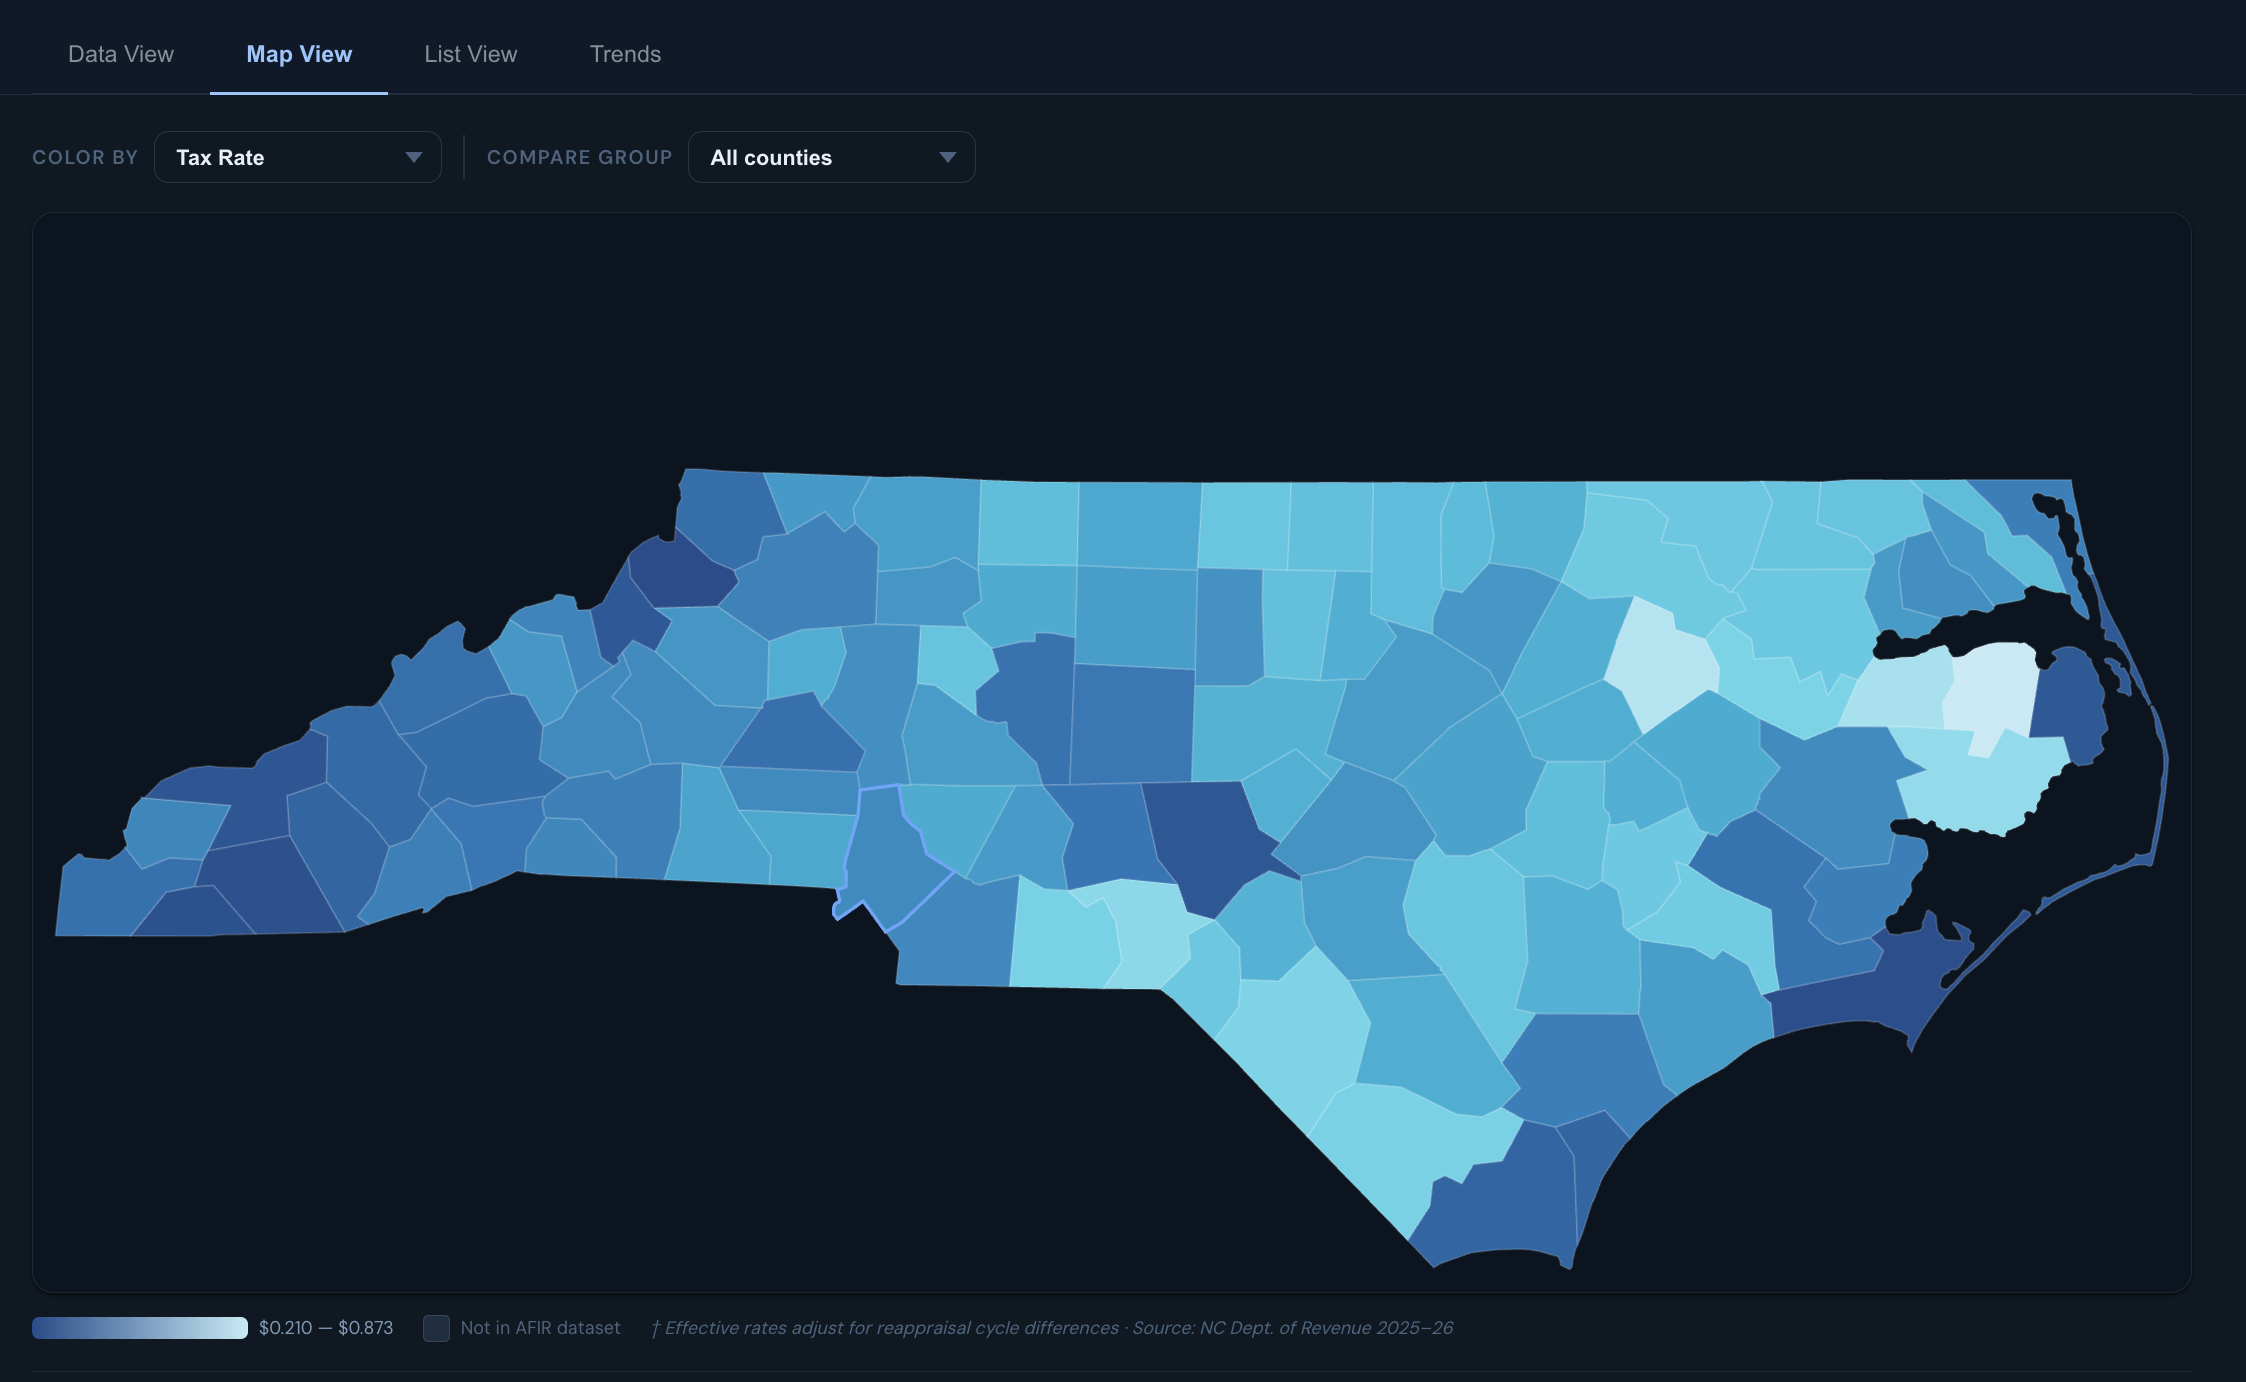
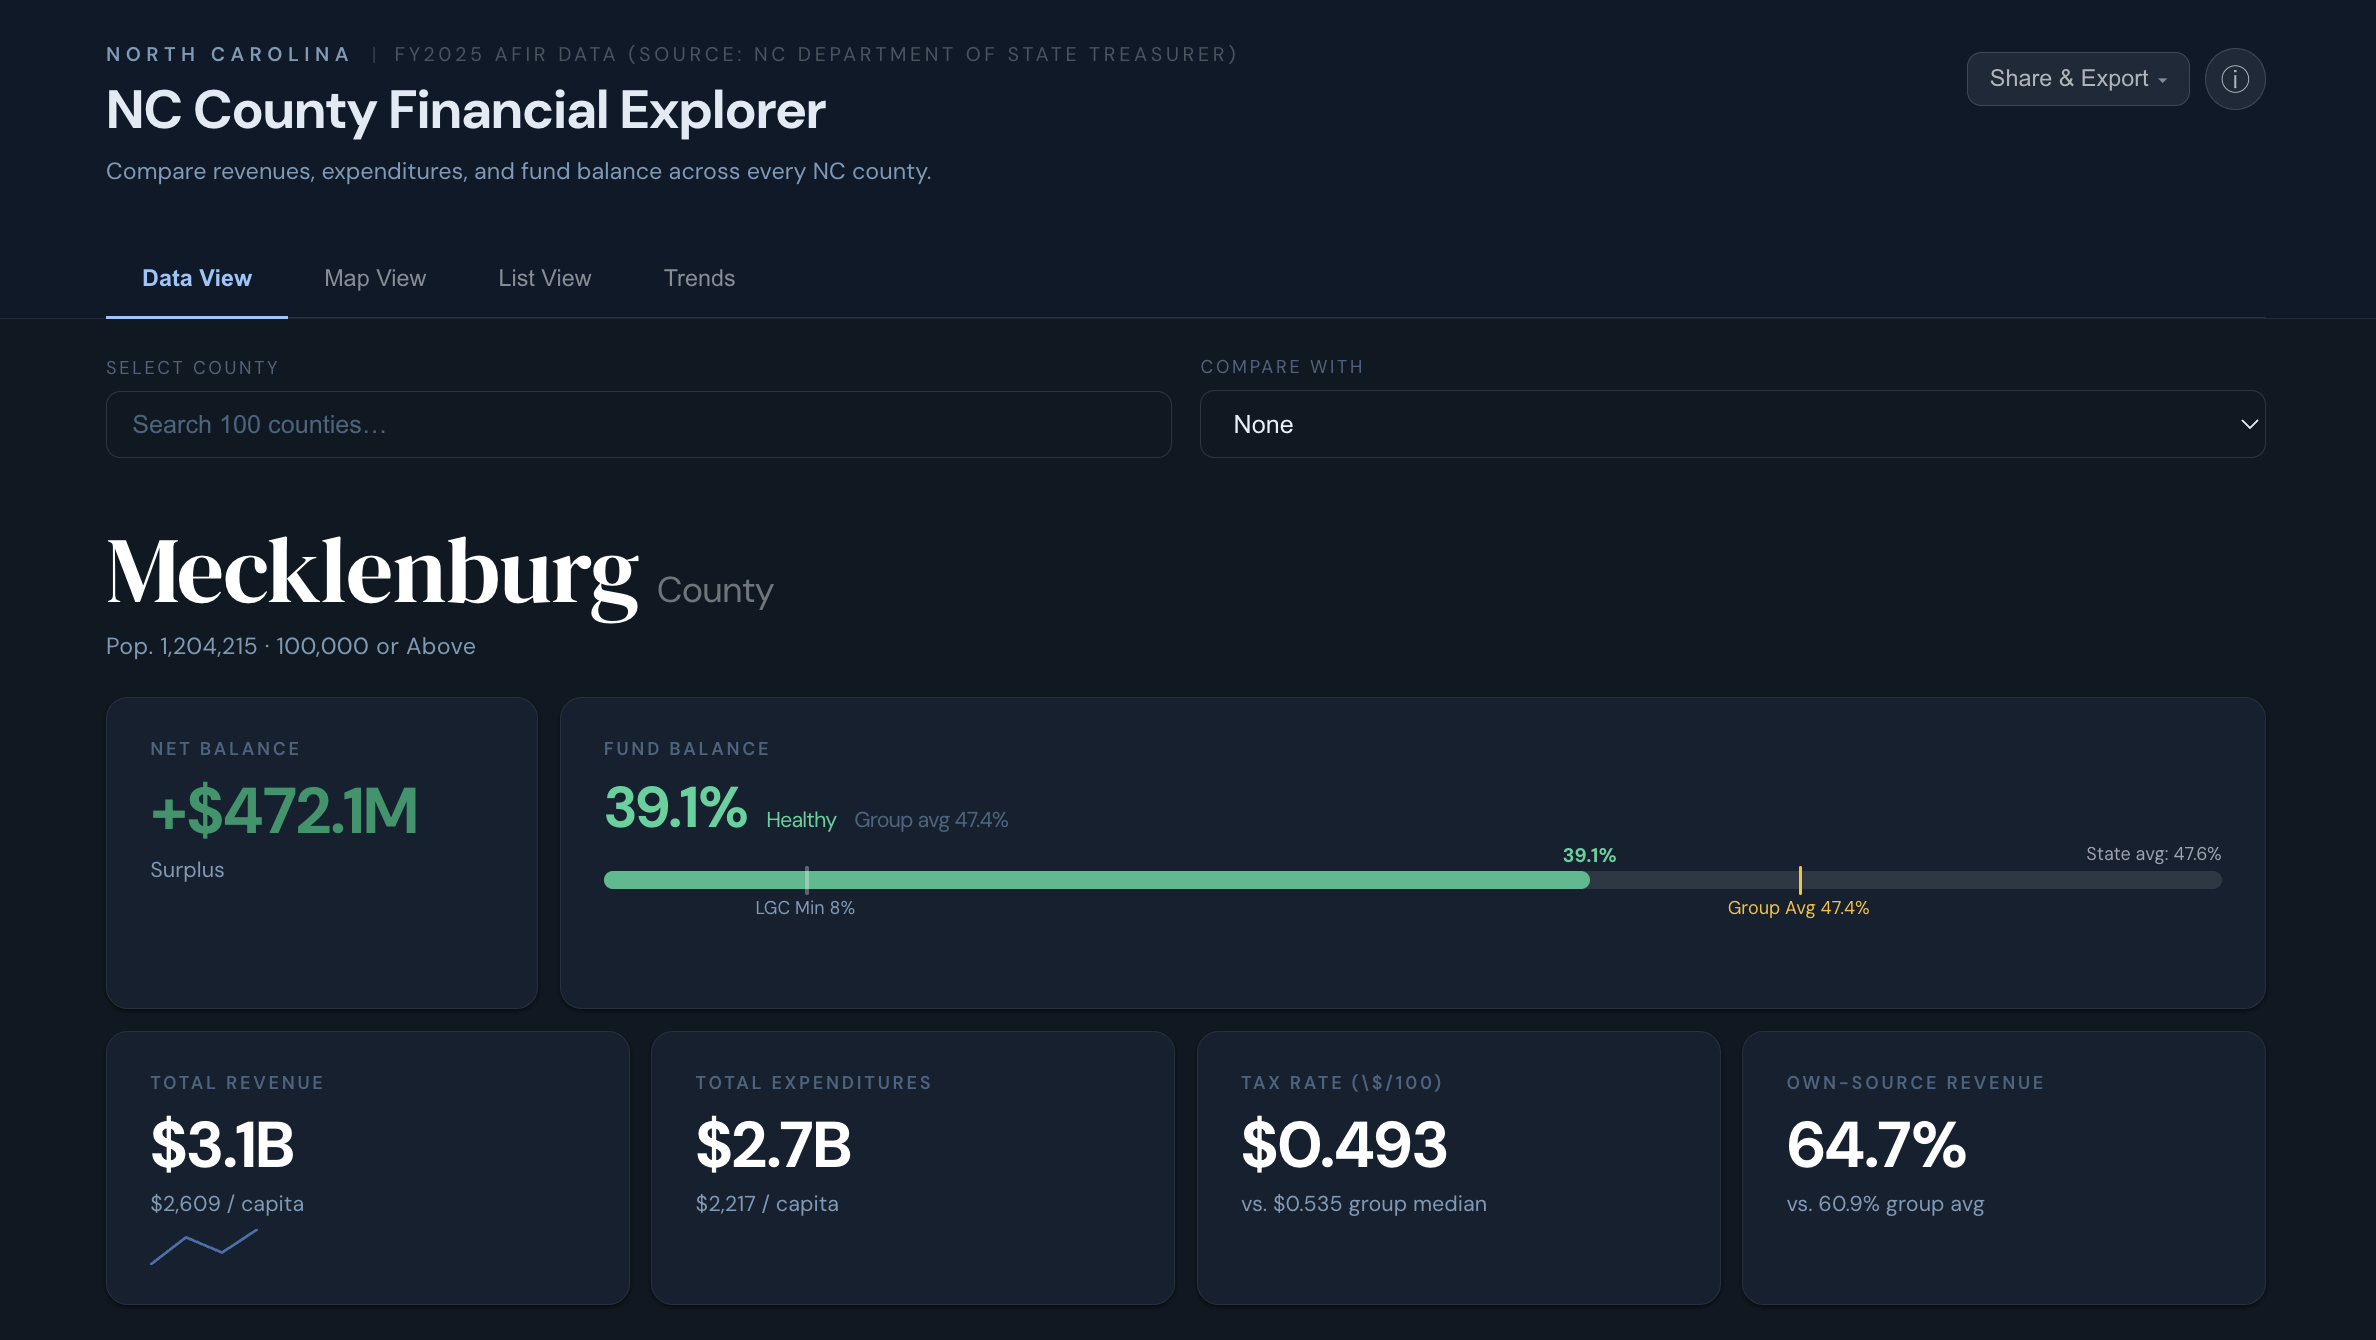
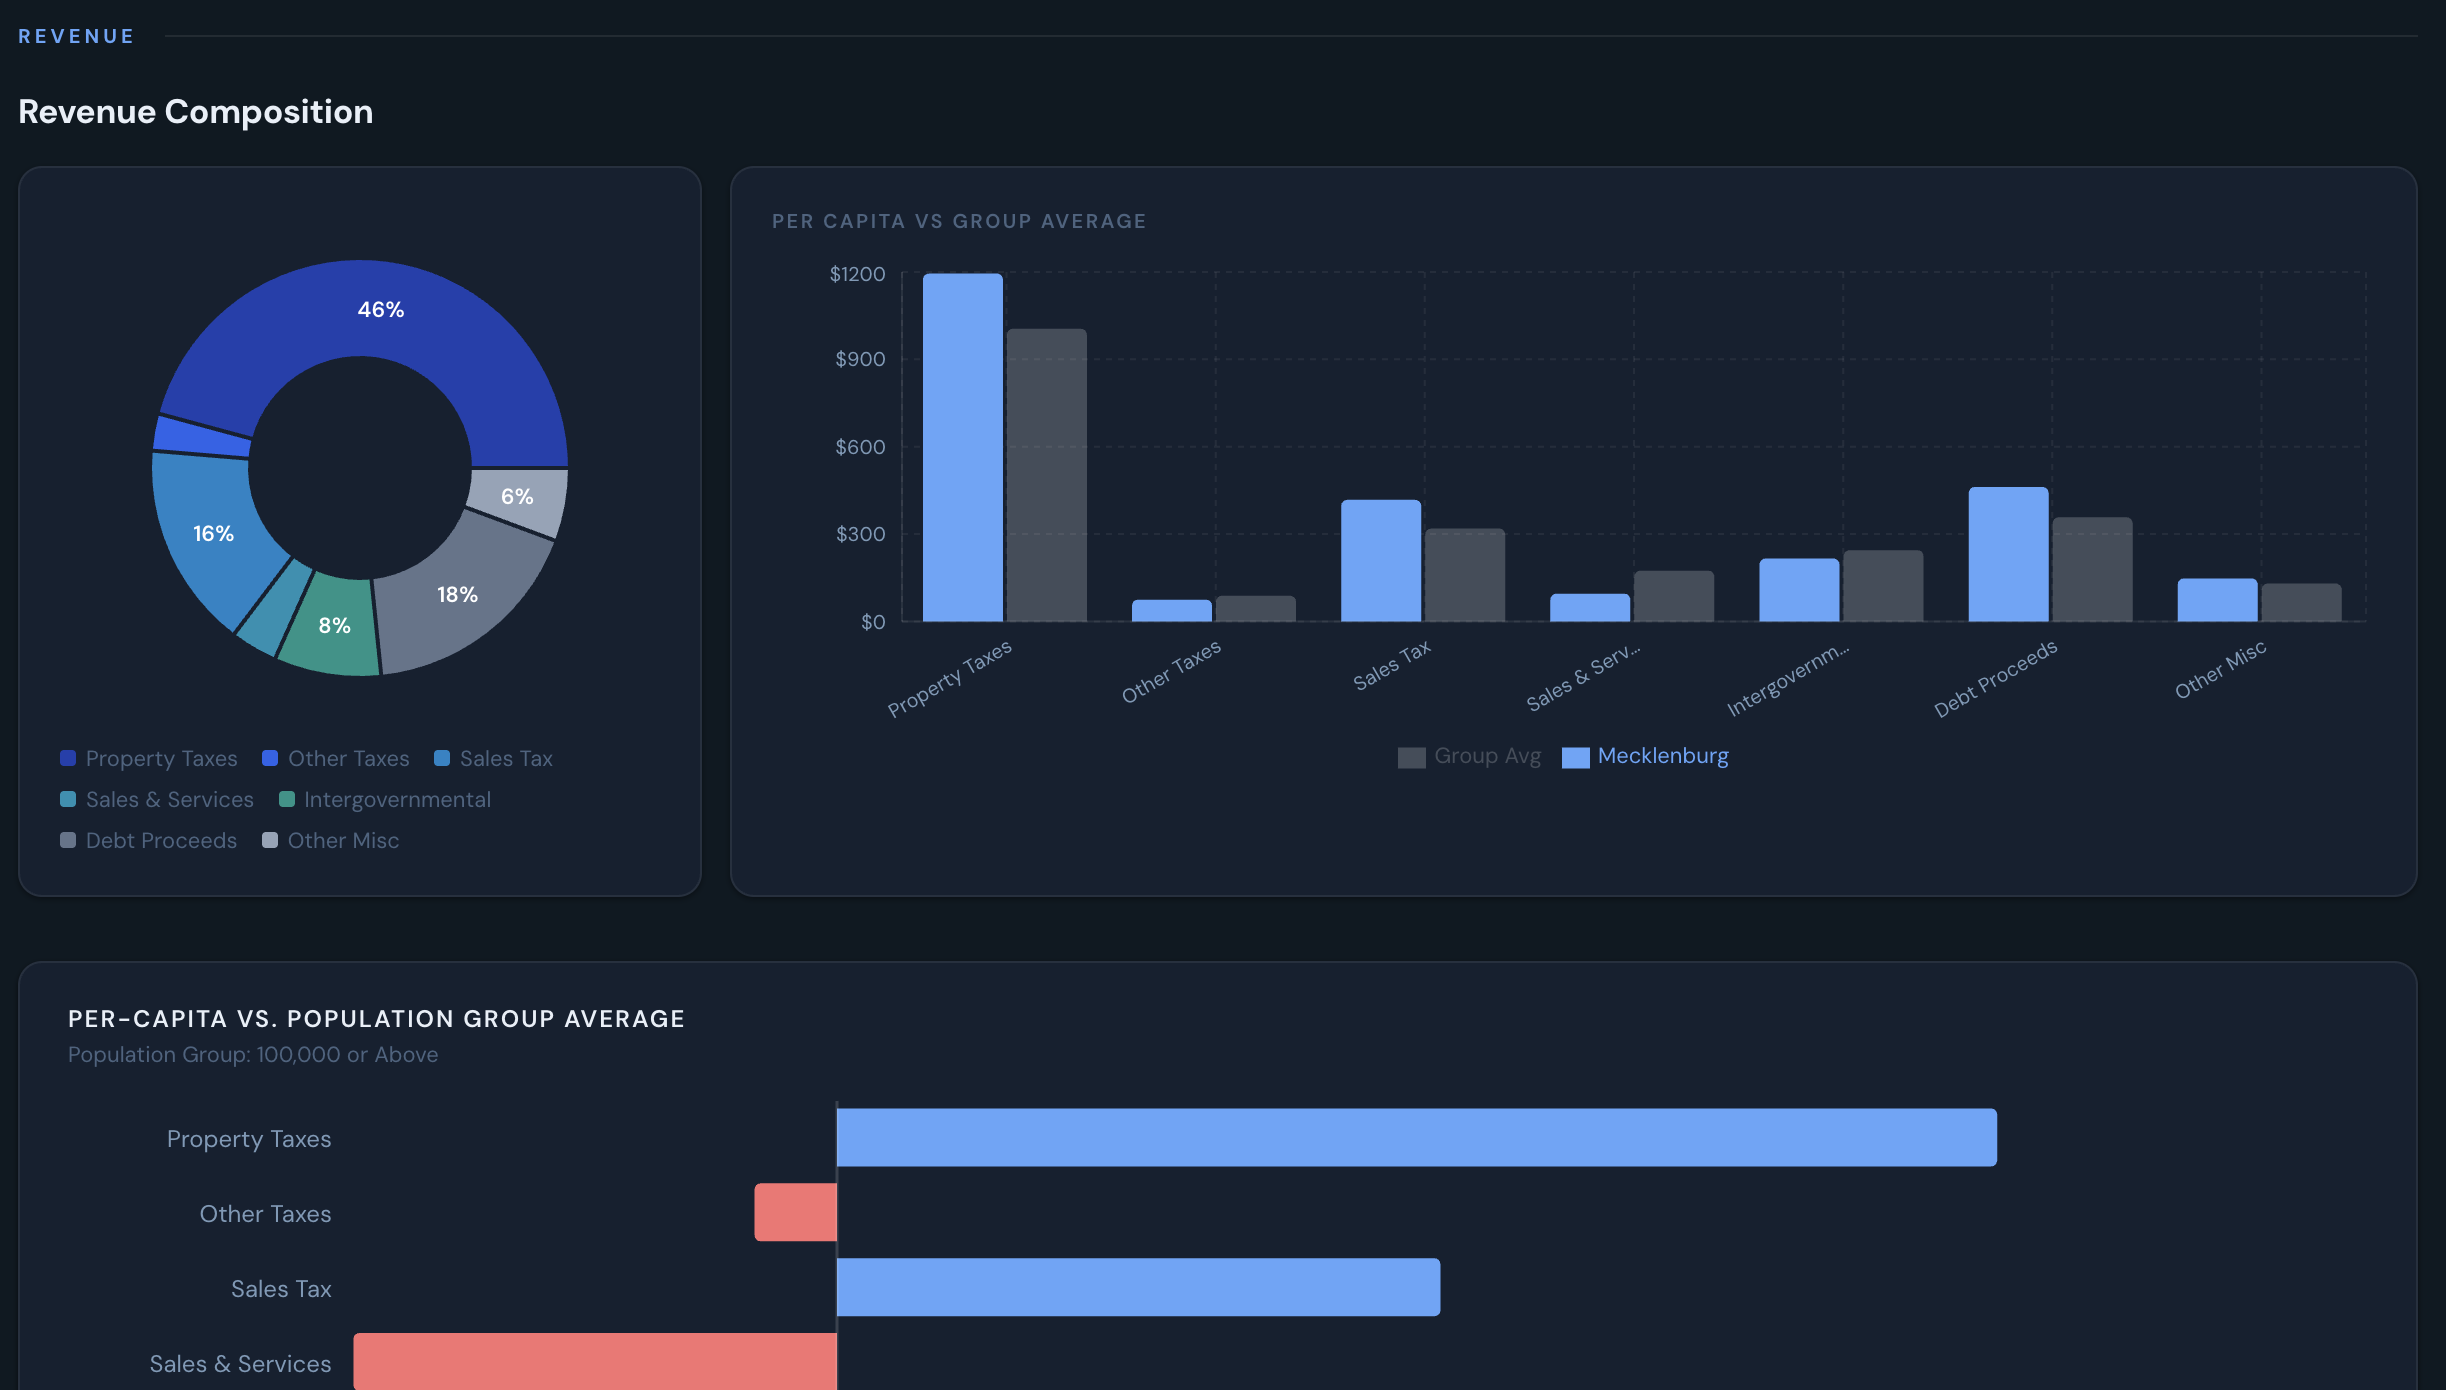
I built this benchmarking tool after discussions with budget analysts from across North Carolina. Before this tool, county financial data had to be downloaded in .xlsx form one-by-one from the treasurer's website to be viewable. This made benchmarking a tedious and tiring experience. Using Claude Code and Codex to help, I built an interactive data visualization of North Carolina county finances covering all 100 counties with revenue and expenditure breakdowns, per capita comparisons, choropleth mapping, and multi-year trend analysis.
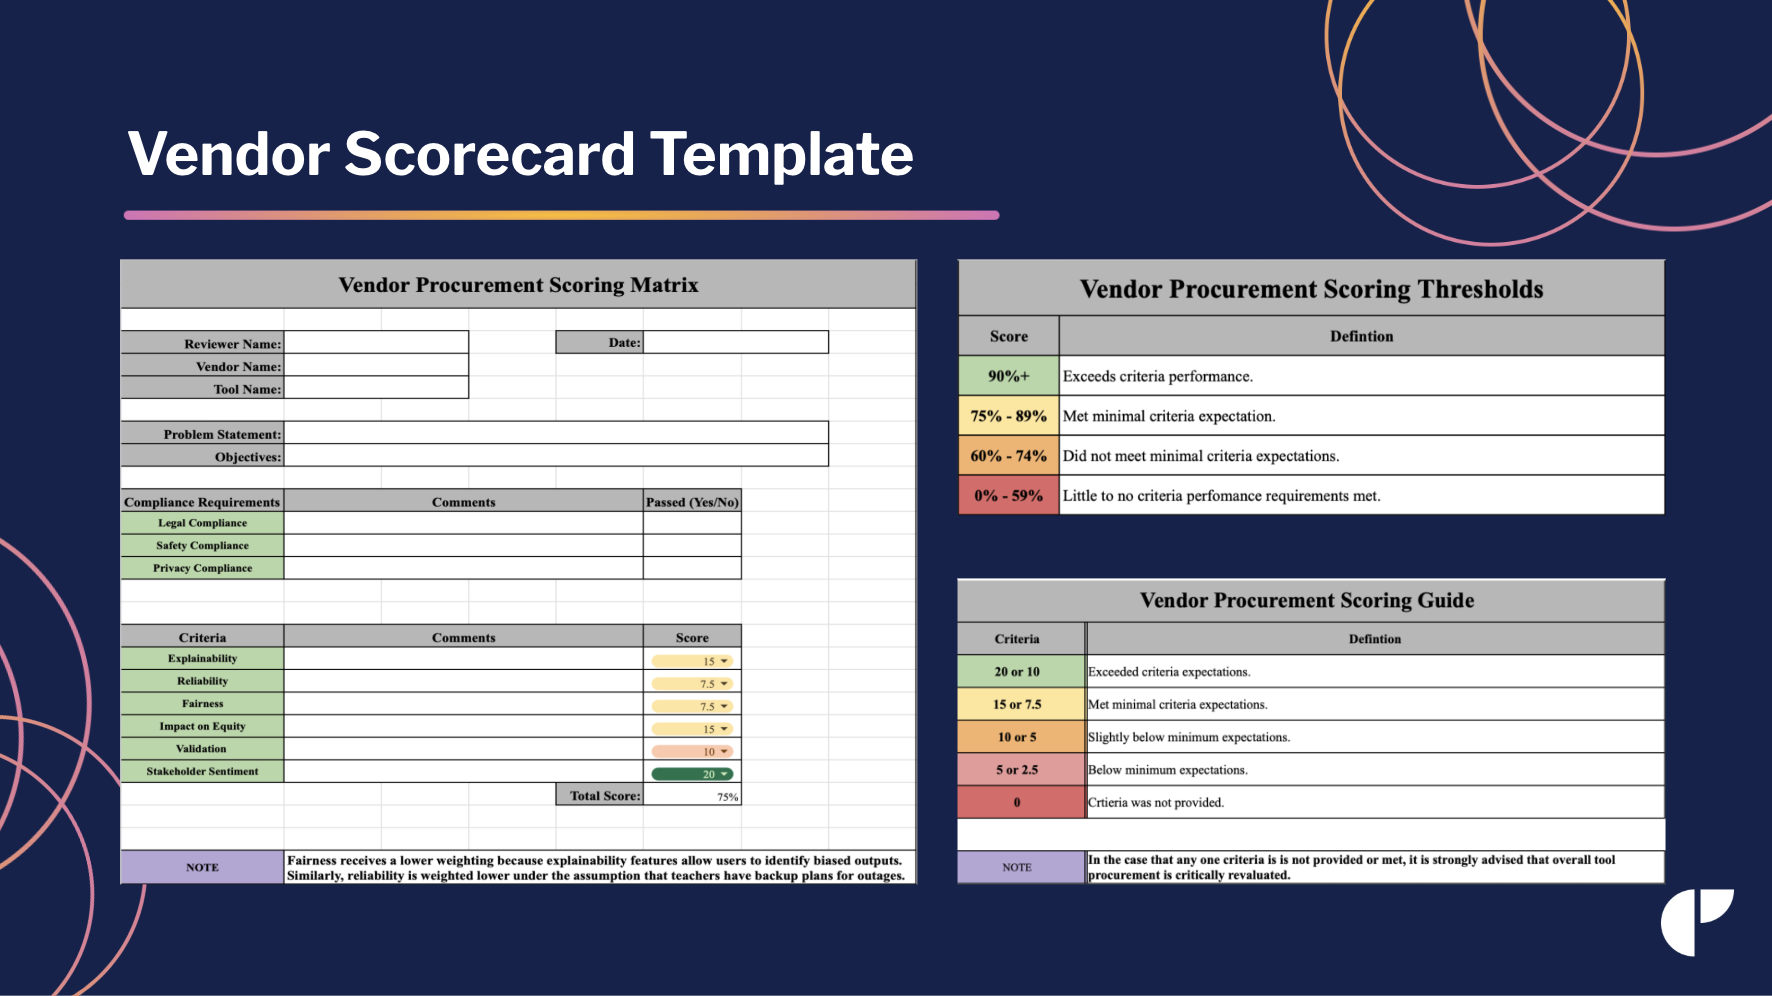
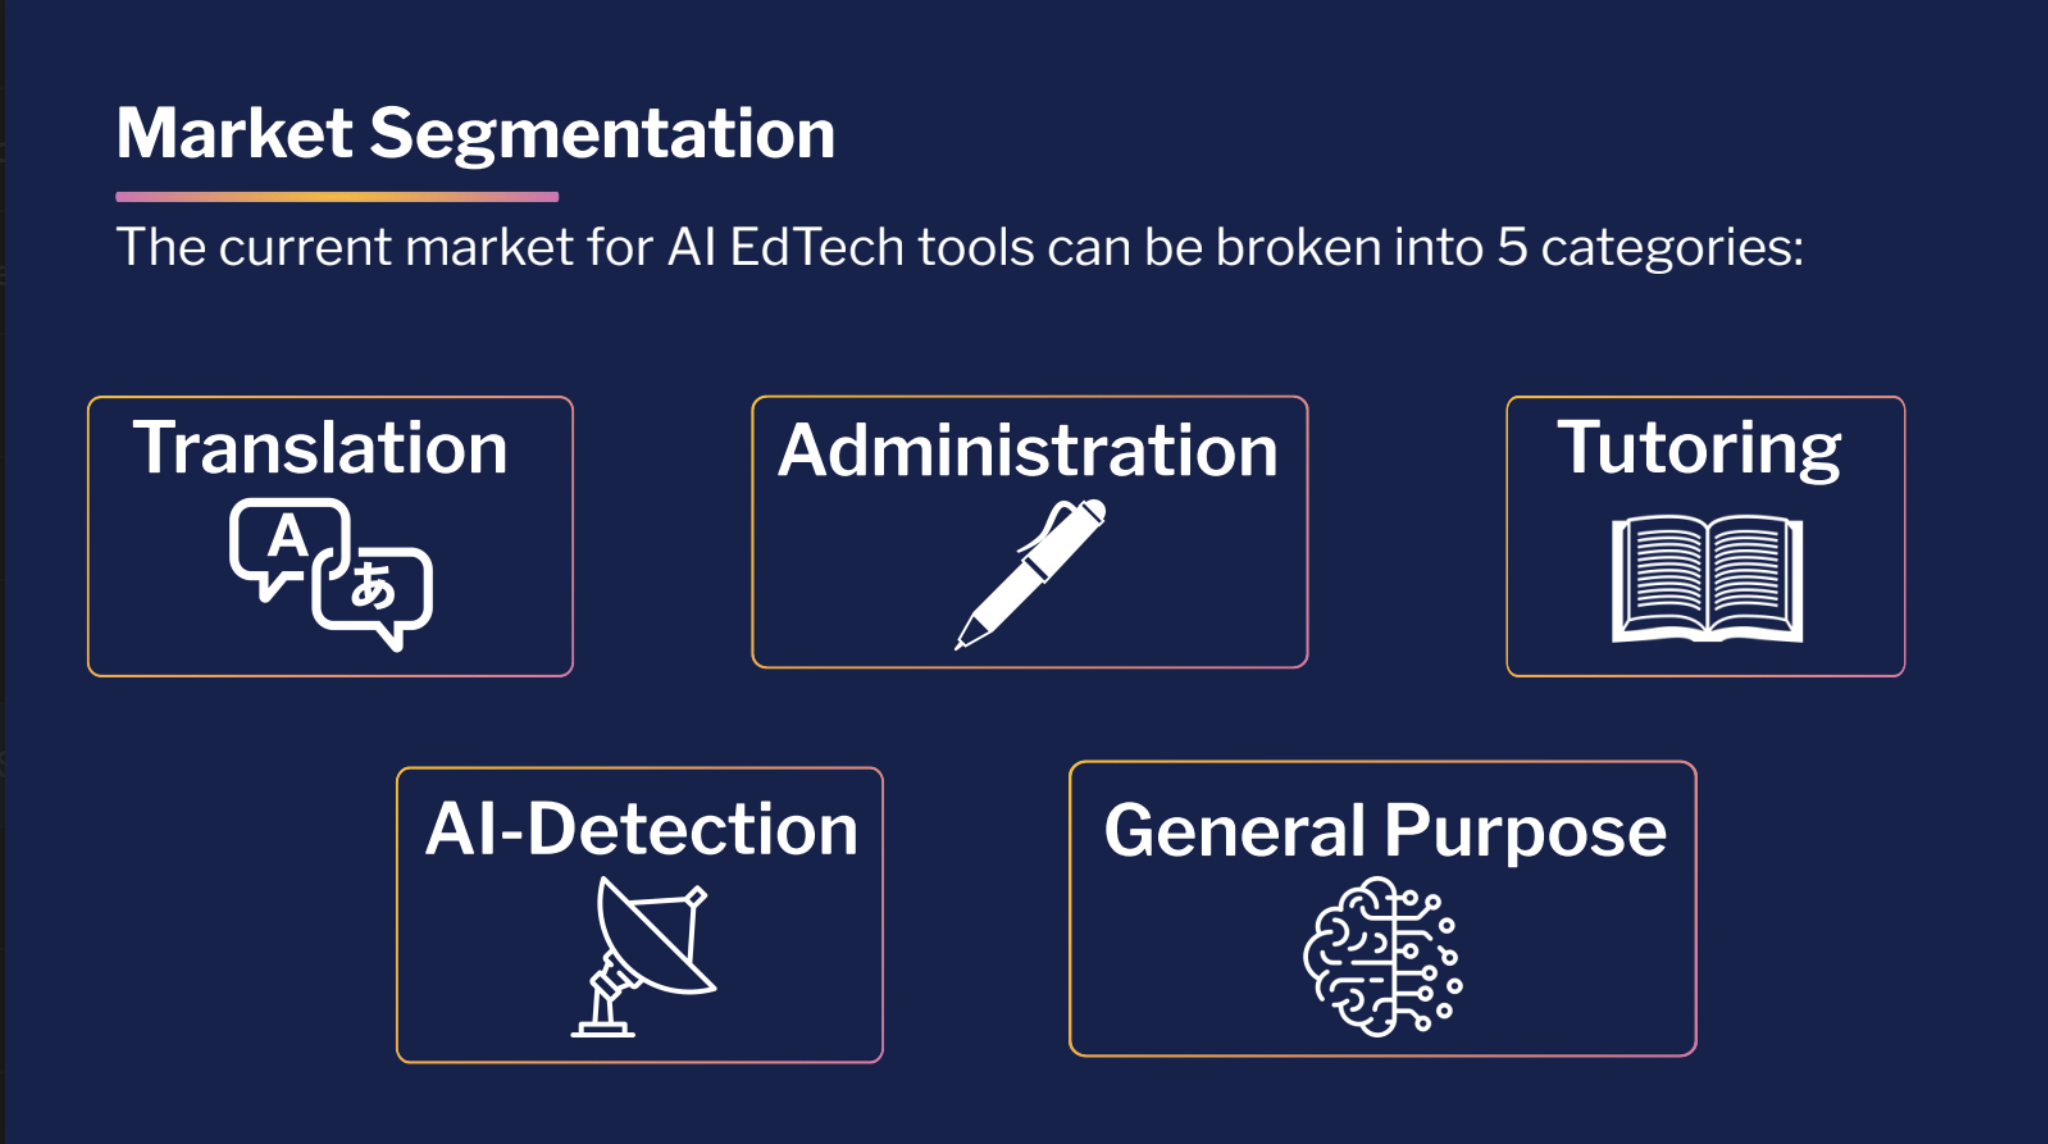
Like all school districts, NYC Public Schools is curious about the impact AI may have on K-12 education. As the nation's largest school district (1M+ students, $38B budget), they are uniquely flooded with pitches and demo requests from vendors selling unvetted tools. Through the Paragon Policy Fellowship, I led a team of nine in developing an AI procurement and evaluation framework for NYC Public Schools to help them stay current while avoiding AI snake oil. Our team delivered market segmentation analysis, stakeholder mapping, and an original AI Procurement Scoring Matrix to support district leadership in making evidence-based tech investment decisions at scale.
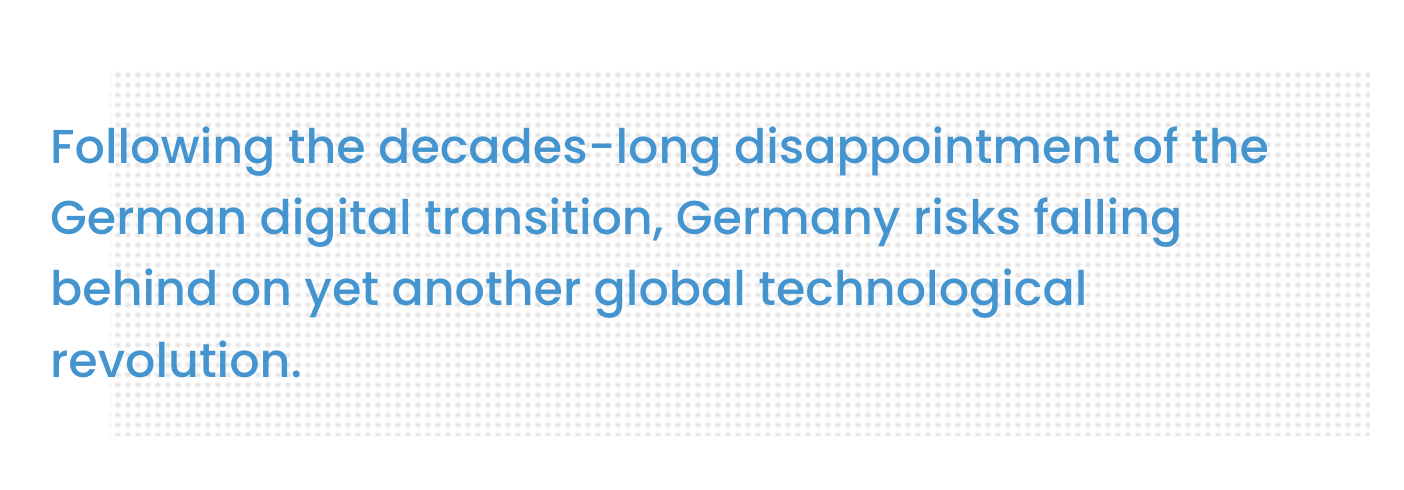
At the American-German Institute, I conducted independent research on AI policy trends in the U.S. and Germany at a Washington, D.C. think tank. I published five articles covering Germany's national AI strategy, opportunities for transatlantic AI collaboration, and key technology policymakers in the new German government.

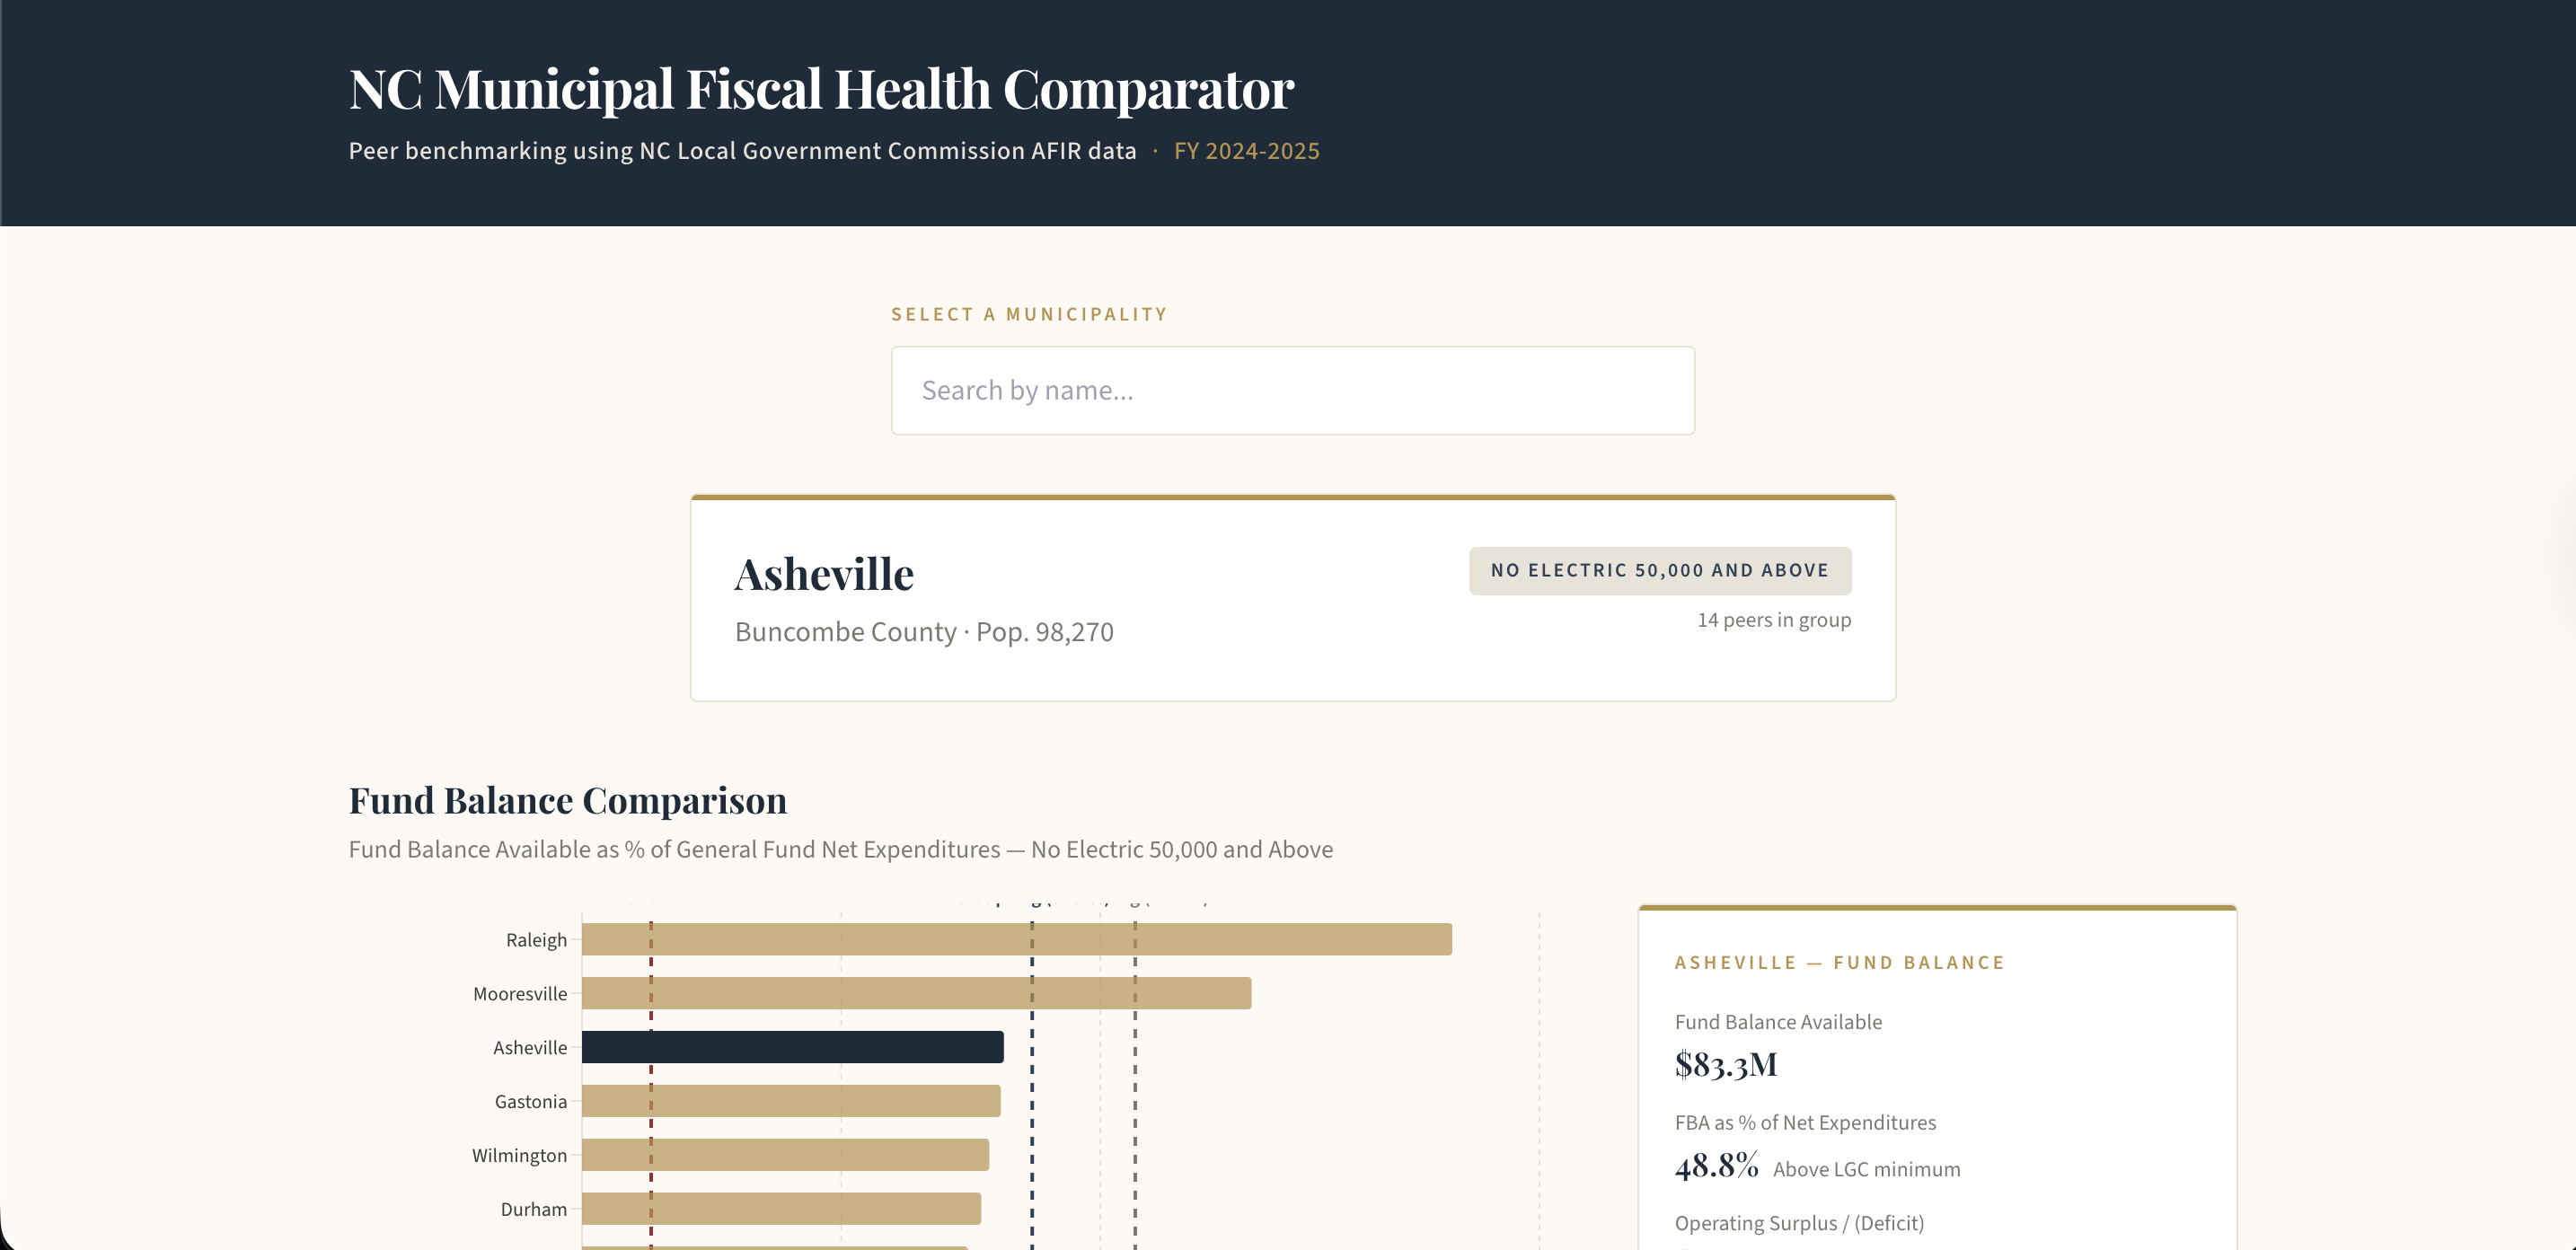
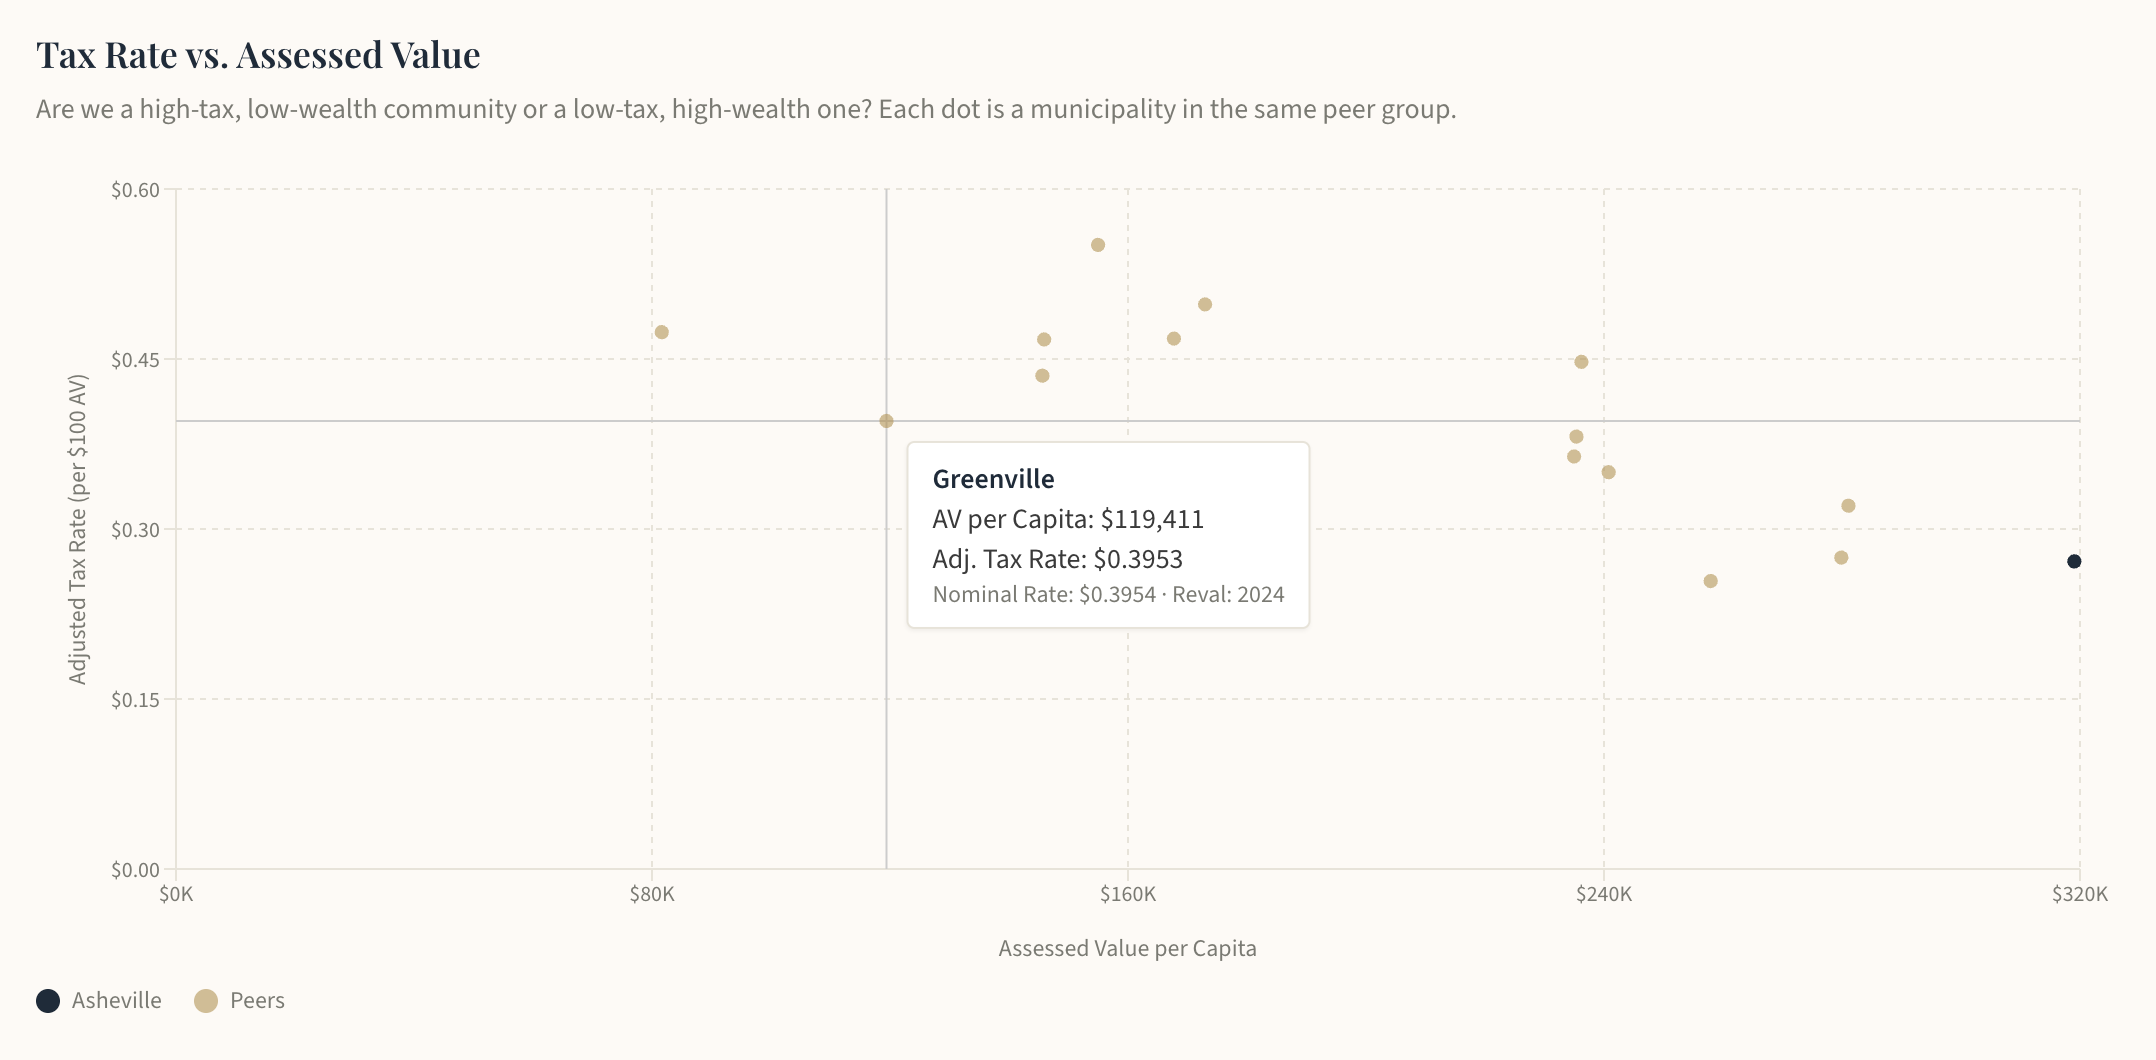
I built this tool to solve the specific problem of inaccessible benchmarking data for NC cities and towns. Select any NC municipality and compare key fiscal health indicators, fund balance levels, property tax rates, and tax-to-assessed-value ratios, against peer municipalities in the same NC classification group.